Data Science Visualization
Data
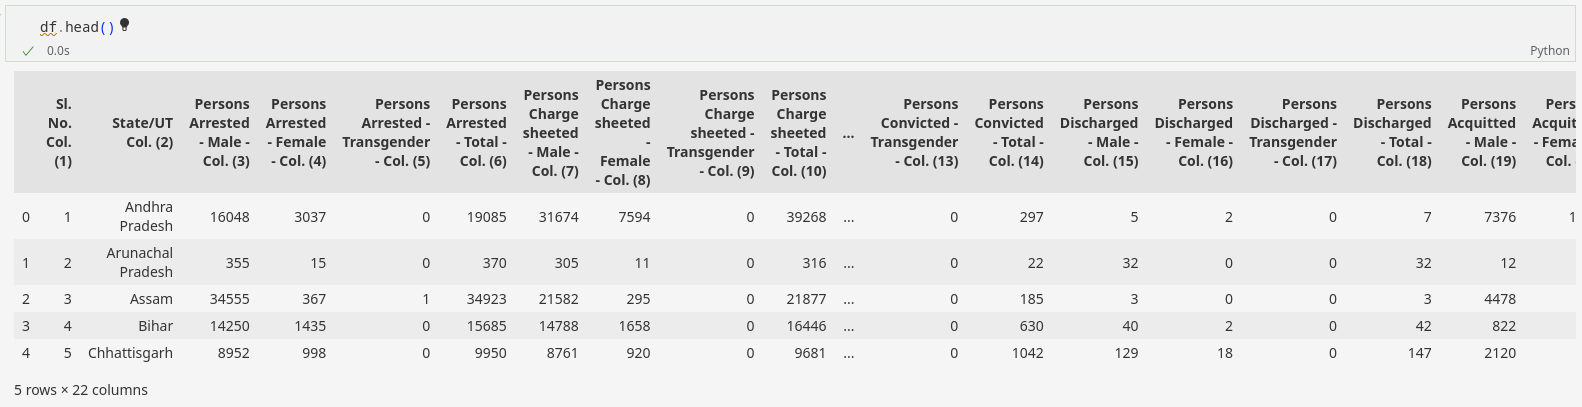
This data contains statewise, gender-specific numbers of persons arrested, charge-sheeted, convicted, discharged and acquitted.
Genders: male, female, transgender
Accused statuses
- Arrested — seized by legal authority and taken into custody
- Charge-sheeted — charges are framed on the accused by the magistrate
- Convicted — the accused has been declared guilty
- Discharged — not enough grounds to lead proceedings against the accused
- Acquitted — the accused is not guilty of the offence
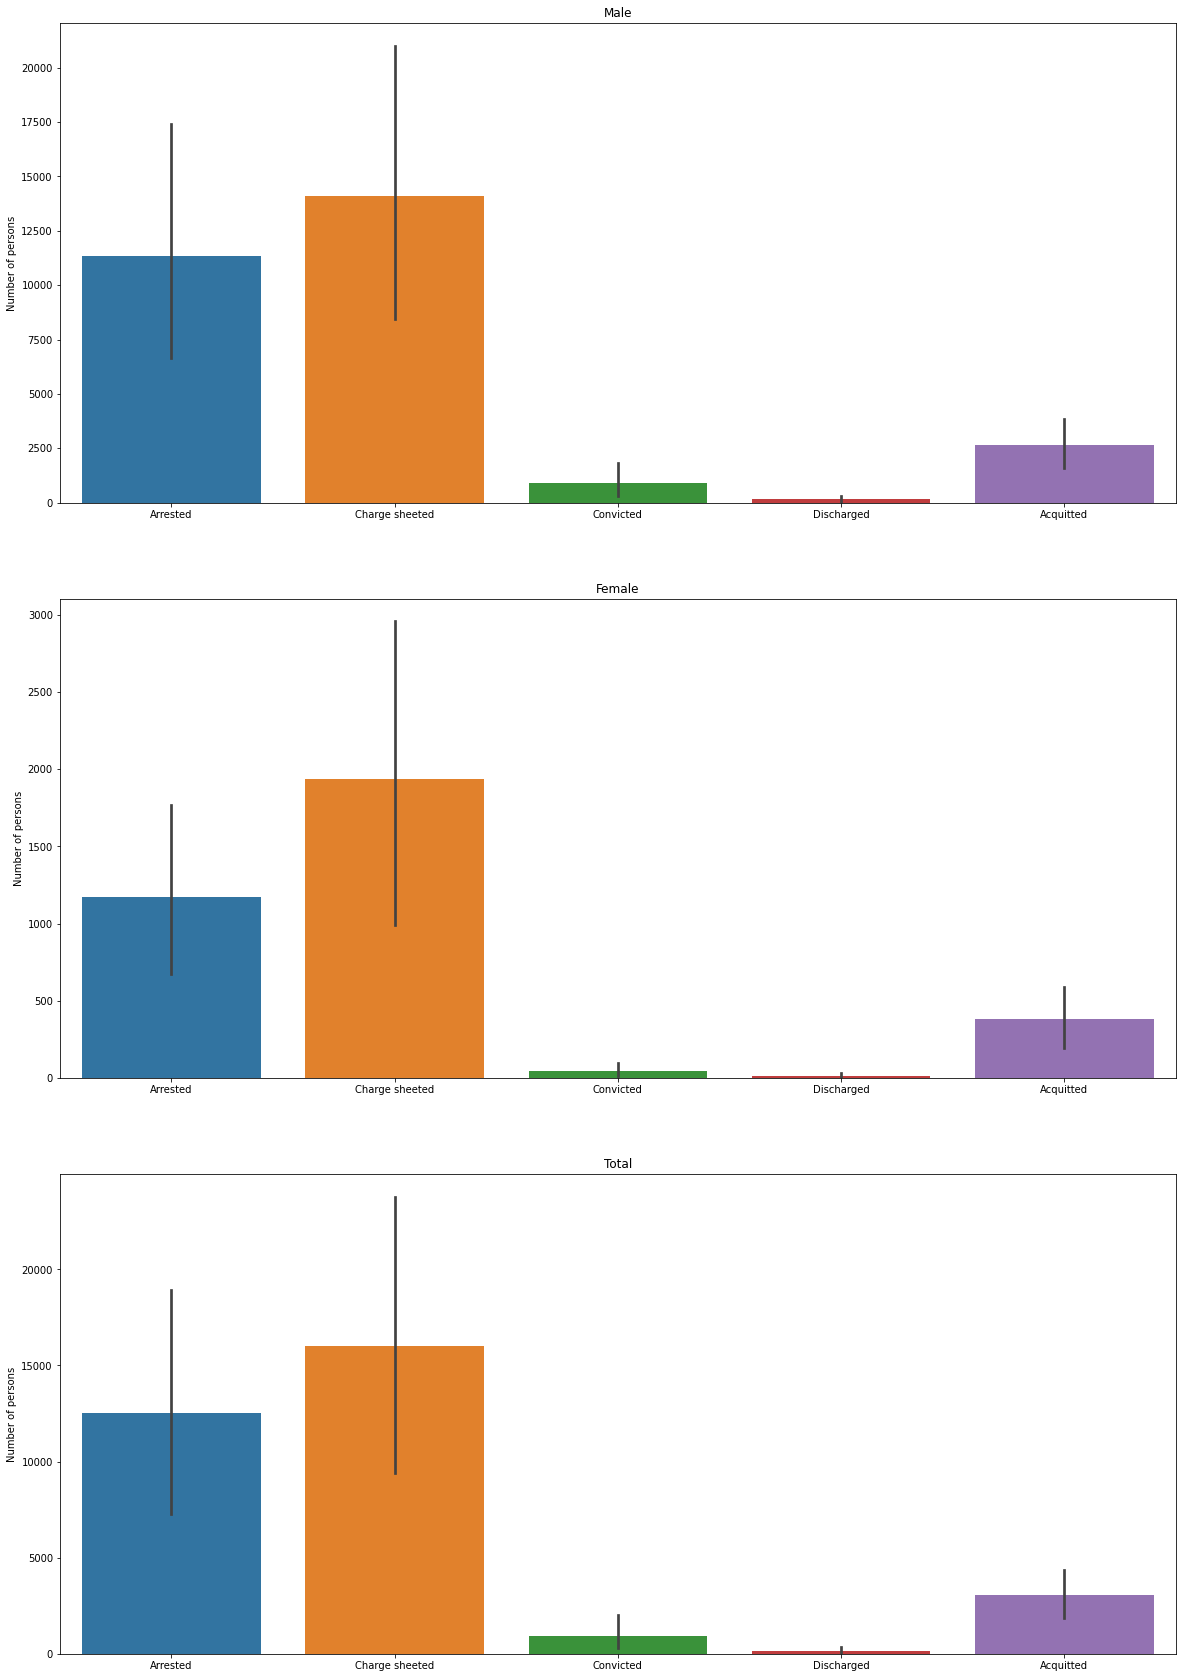
Bar plot
Here we plot the number of people in each category for male, female and total. For data with distinct categories, a bar graph displays the values well.
The bar plots show that of the large number of people charge-sheeted, most are arrested, and of those the majority are acquitted for lack of evidence. The percentage actually convicted is very low.
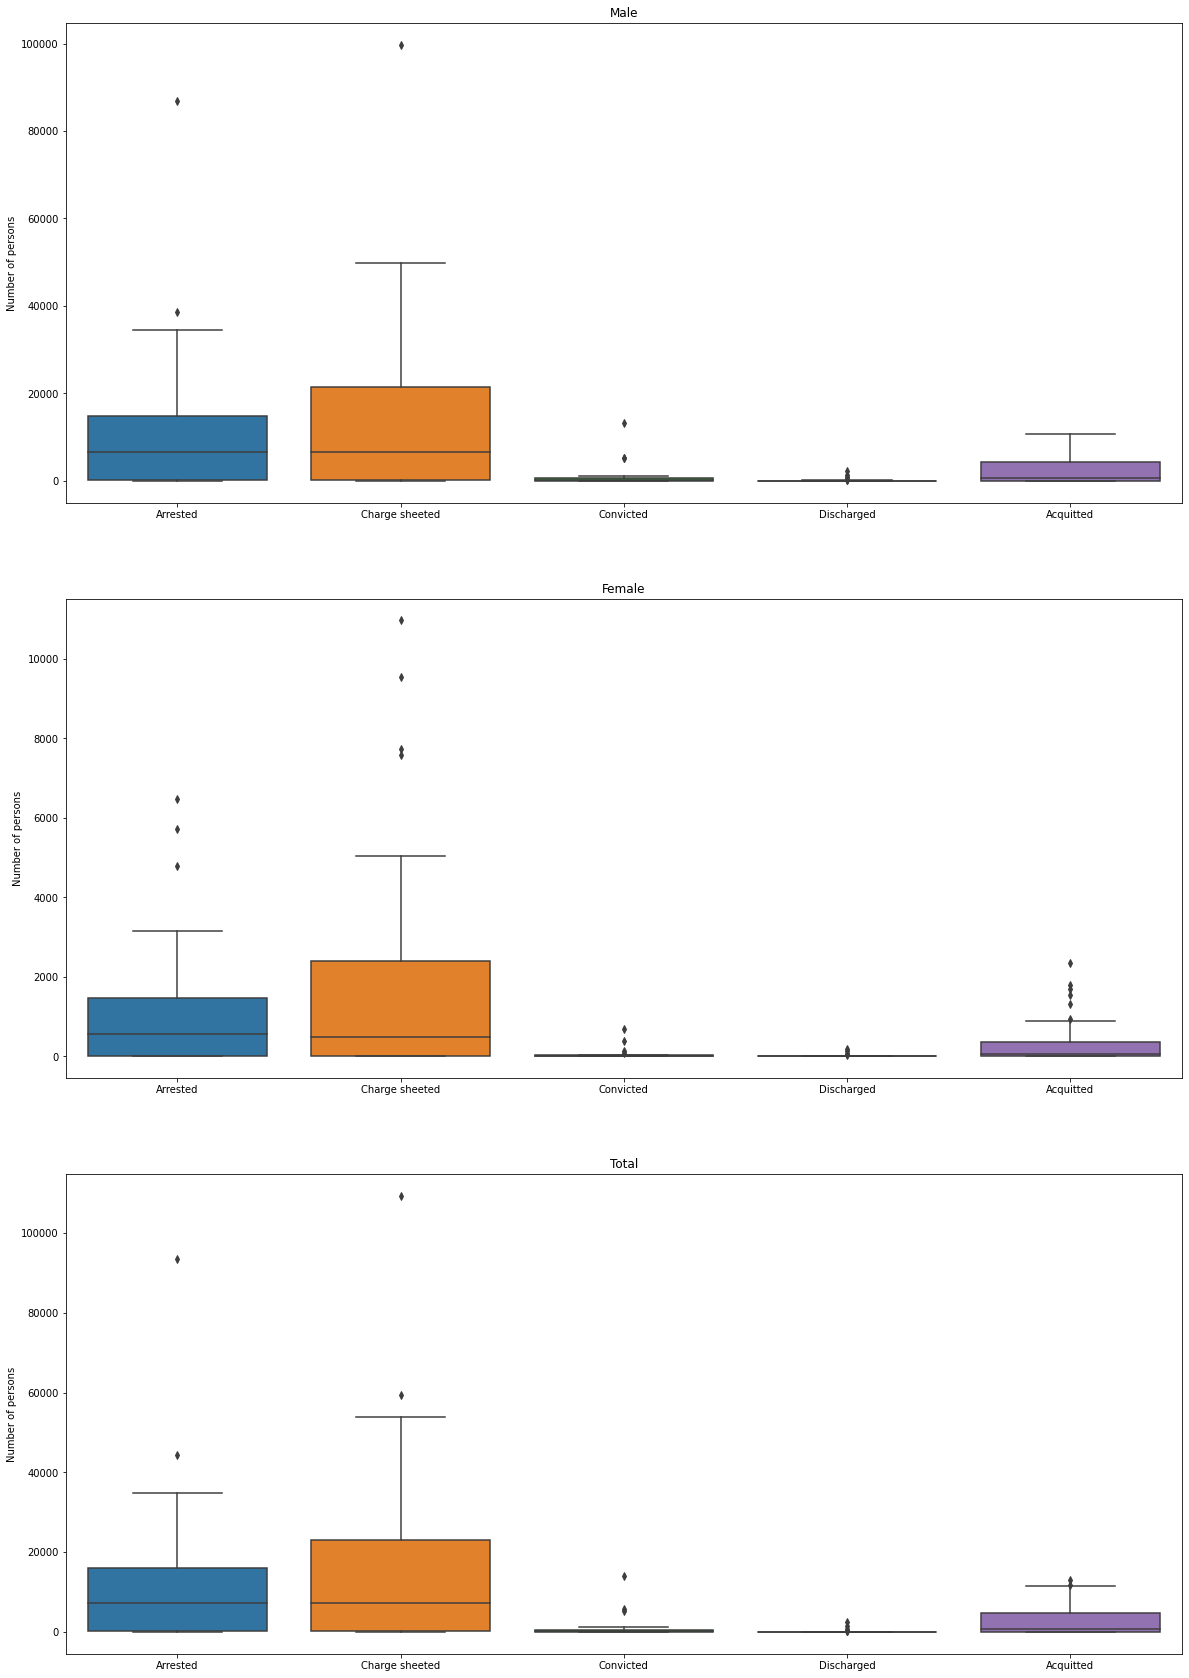
Box plot
A box plot summarises a large amount of data in five numbers: the median, upper quartile, lower quartile, minimum and maximum. It gives a clear summary and also surfaces outliers.
The box plots show the data is skewed towards the lower quartile, so values above the upper quartile can be treated as outliers.
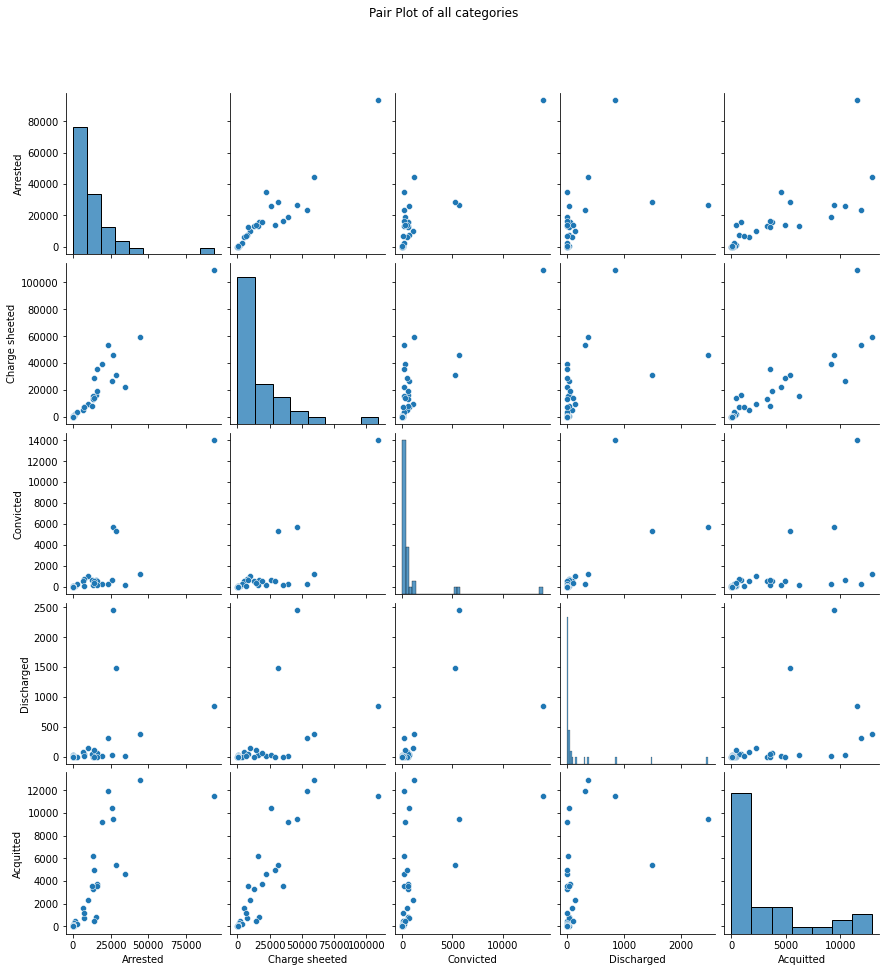
Pair plot
A pair plot helps identify the best set of features to explain a relationship between two variables, or to form the most clearly separated clusters.
The pair plot shows the most strongly correlated feature pairs are (arrested, charge-sheeted) and (charge-sheeted, acquitted).